If you’ve followed our Facebook Page for long, and to a lesser extent our Twitter (due to character limits) and Instagram (due to short time of existence), you’ve no doubt seen and heard me refer to what’s going on in the Bering Sea and Aleutian Island chain. There’s a solid reason for that, and I will briefly explain it here.
Following and studying weather as long as I have, I often heard statements to the effect of “Warm Alaska, cold Central U.S.” or “Cold Alaska, warm Central U.S.” The mechanics of that made perfect sense to me, but didn’t hold a lot of forecasting value beyond a few days without depending on forecast models to be correct two weeks out (which they rarely are). However, a few years ago our friends at BAMwx.com (then BAM Chase) began talking about the “Bering Sea Rule” (BSR). It’s an idea first delved into by Joe Renken in 2011, and elaborated on in depth in this Abstract he wrote with several others and had published by the National Oceanic and Atmospheric Association (NOAA) in 2015. The BSR states that one can look at storms in the Bering Sea and Aleutians and reasonably forecast a storm in the Eastern half to two-thirds of the U.S. at some point 17-21 days later. Since that time, they have tried to narrow it down to where a storm’s location relative to the Aleutians could be used to indicate a relative location in the U.S.
So, how accurate is it? I find that it works reasonably well when used correctly, and used as an approximation, *not* for exact location. I also find that the lag times can be as short as 14 days or as long as 24 days, depending on how quickly the global pattern is moving. At the time of this writing (December 17, 2020) the pattern is active and the lag is about 16-20 days. I also believe the particular season, as well as strengths and phases of other atmospheric oscillations can affect the relative locations of the Aleutians to the U.S. I have begun tracking this by creating a PowerPoint to lay a U.S. map over North Pacific charts created by the Ocean Prediction Center. We’ll have to see how consistently the BSR translates to certain areas of the U.S., and if that is affected by seasons and oscillations.
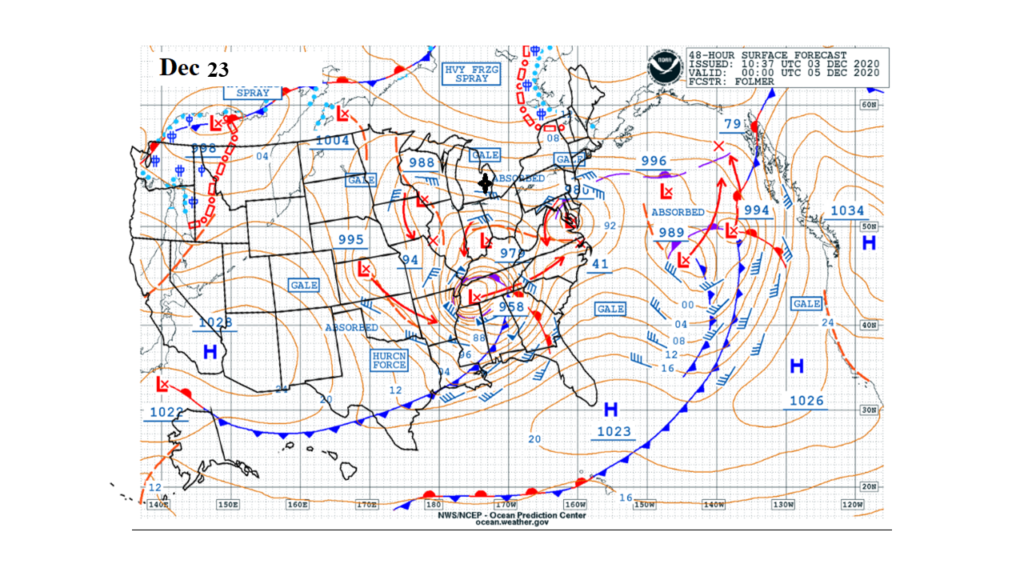
To close this out, I will leave you with this part of my experiment. I currently have the U.S. layered over the Aleutians relative to the way the current East Coast storm has been positioned over the last three days. BSR has predicted its positions very well . *IF* it were to remain that way, the maps below are the way things would play out around the 23rd to 24th time frame. BSR would indicate a smaller storm (likely rain changing to snow) on the 23rd, and a larger storm (possibly heavy snow) on the 24th Heavy snow seems more likely farther east, but that remains to be seen. Of course, these could happen a day or two sooner or later and the exact track is uncertain. So, let’s sit back and see how it unfolds.