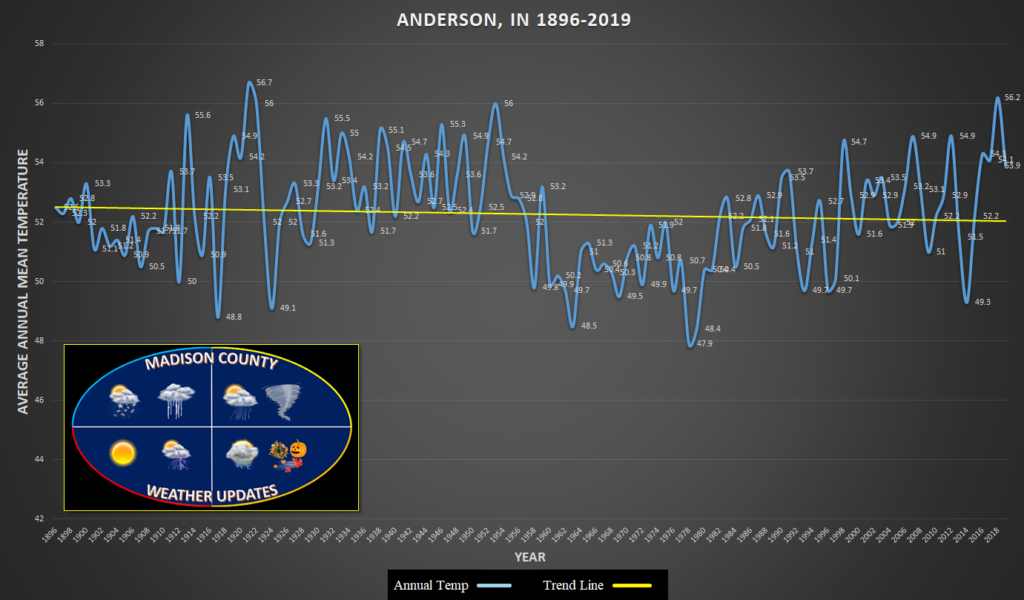
I’ve been asked several times about the temperature trends for Madison County. Are temperatures getting warmer? Are they getting colder? Is there even a trend? So in this short article I will tackle that question.
The attached charts cover the mean or median temperature of every year from 1896 (the first complete year of data for Anderson) to 2019 (the last complete year of data). To compile the annual mean temperature graph, I utilized information from the Indianapolis National Weather Service “NOW Data” tab and copied the years and data into a spreadsheet. There were a handful of years where the Anderson data had missing months. In those cases, I used data from Indianapolis to fill in the missing months, then calculated the annual mean temperature.
Both images are just versions of the same chart. In the clean version you can see the overall temperature trend line has been slightly cooler as time has progressed. I need to make it clear this is for ANDERSON ONLY and should not be confused with global temperature trends.
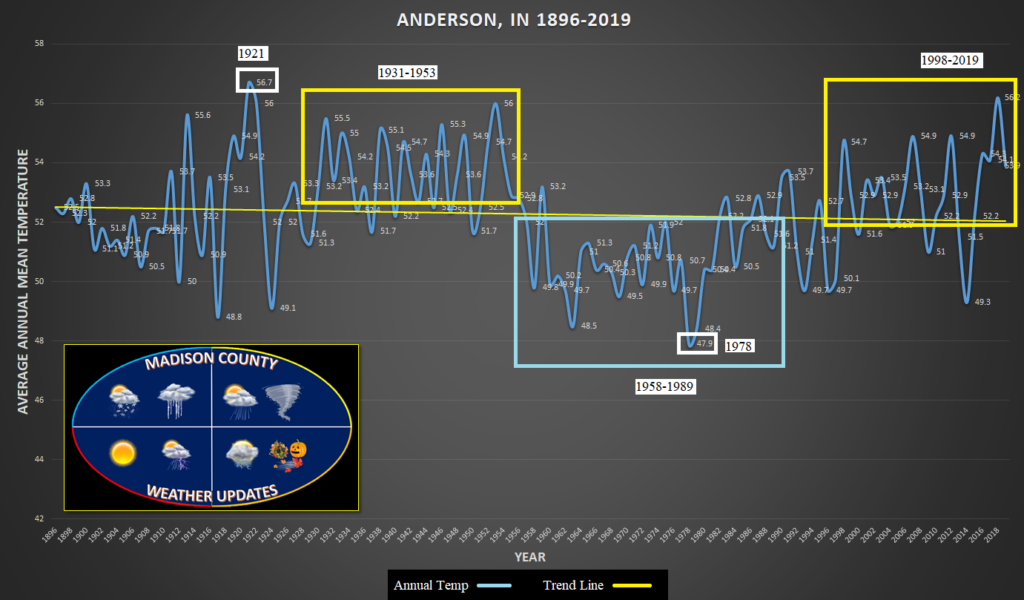
In the second image I have noted the warmest (1921) and coolest (1978) years in our recorded history. I have also boxed in three distinct temperature cycles. The first is a period from 1931 to 1953 where all but three of the years were warmer than the trend line. The second is 1958 to 1989 where all but three of the years were below the trend line. The last is the cycle we’re currently in, which has spanned from 1998 thru 2019 (really thru the present) where all but four of the years have been above the trend line. One could argue I could have moved the start of the first warm cycle back to 1917, and could have extended the cold cycle to 1997; but the main thing is, the trends can be seen.
Depending on how you want to look at the data, there are also two other trends one could view in this data set. You could say there was a warming trend from 1901 to 1953, a reset to cooler from 1954-57, then another warming trend from 1958 thru the present. Often, data is in the eye of the beholder. Could we be ready to reset again? Or will the warming continue? Only time will tell.
I hope you enjoy this brief look at the historic temperature trends for Anderson/Madison County. I may do something similar for snowfall. However, I will have to use Indianapolis data for that, since Anderson has a lot of missing snowfall data over the years.